Brent Oil at a Crossroads: Potential Price Rise Ahead?
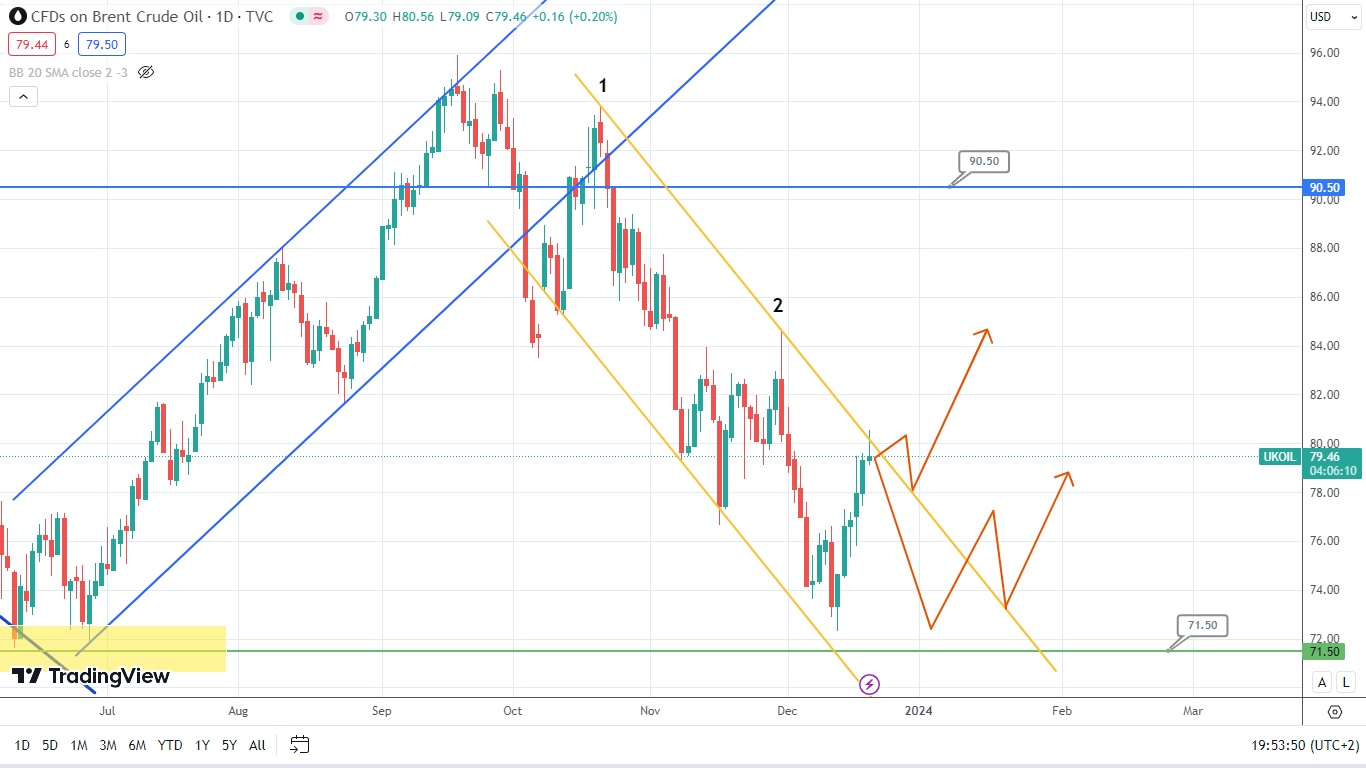
Brent oil is testing the upper boundary of the downtrend, trying to form a shooting star. The price of this asset might either rebound from the downtrend and gain the required support at the level of 71.50 or break the downtrend and rise. So, let’s observe which scenario is going to work out.

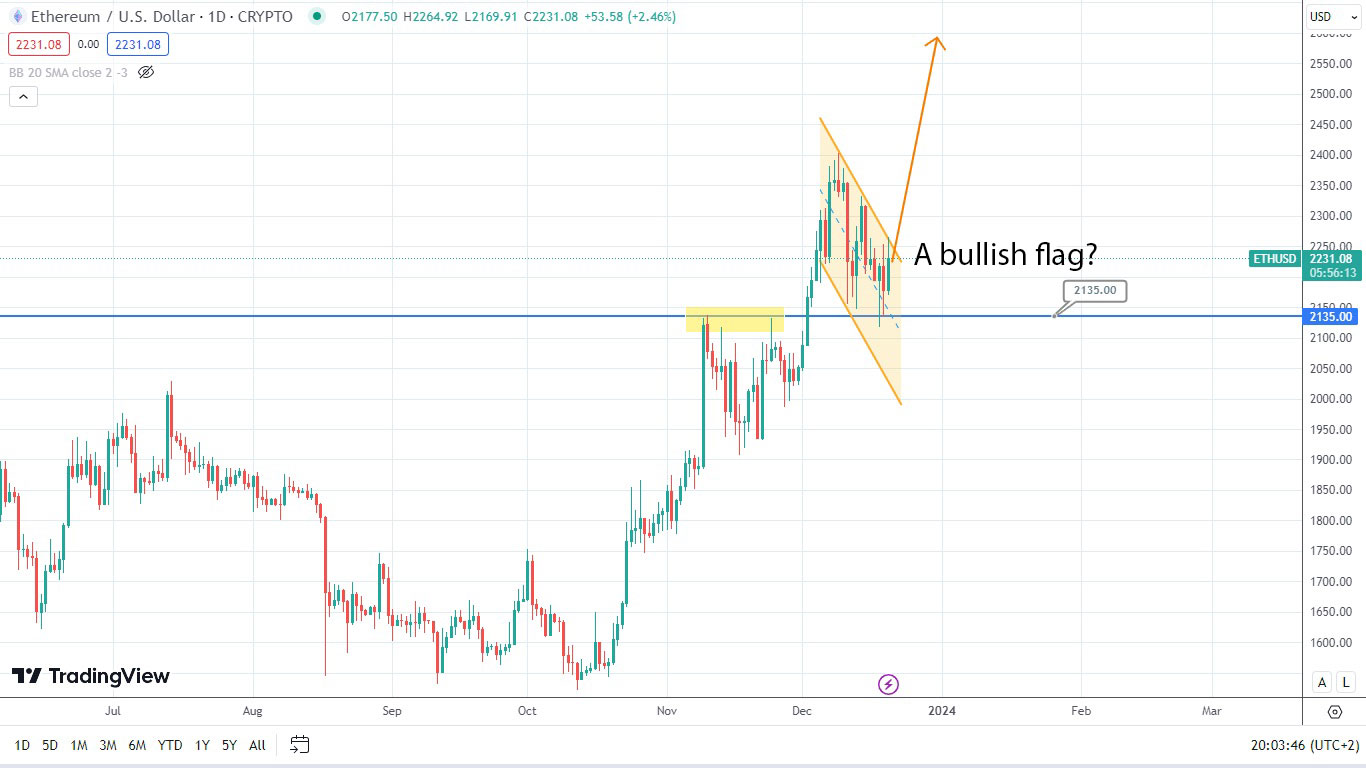
The daily chart of the ETH/USD pair shows signs of the potential formation of a bullish flag. This pattern usually signifies the continuation of the current trend. The flag rests against the supporting level of 2135, indicating that the asset’s price might rise soon.
The price of the Canadian dollar is heading down and gradually approaching the downtrend and supporting level of 1.3150. The asset’s price might potentially get the required support, rebound, and jump. Hence, it would be very important to follow the candlestick formations to forecast the upcoming price movements.

Disclaimer: The material provided is for information purposes only and should not be considered as investment advice. The views, information, or opinions expressed in the text belong solely to the author, and not to the author’s employer, organization, committee or other group or individual or company.
Past performance is not indicative of future results.
High Risk Warning: CFDs are complex instruments and come with a high risk of losing money rapidly due to leverage. 69% and 73% of retail investor accounts lose money when trading CFDs with Tickmill UK Ltd and Tickmill Europe Ltd respectively. You should consider whether you understand how CFDs work and whether you can afford to take the high risk of losing your money.
Futures and Options: Trading futures and options on margin carries a high degree of risk and may result in losses exceeding your initial investment. These products are not suitable for all investors. Ensure you fully understand the risks and take appropriate care to manage your risk.