Institutional Insights: Goldman Sachs - Framework for Finding Fast Horses and Elephant Trades
.jpeg)
Past the Elephant Trade: Back to the Fastest Horses
FICC and Equities
Trade tensions and tariff-induced recession fears are behind us. However, elevated market volatility and asset price dysfunction could still lead to a recession, but that would be a later development.
- This does not imply that all carry trades or momentum (MOMO) trading will resume immediately, nor does it suggest that a major AI breakthrough is imminent.
- Risk assets might still face a bear market, potentially taking 18-24 months to find a bottom. Don’t expect a return to 24x Nasdaq valuations anytime soon.
- Today’s price reaction has been extreme: 79 basis points of rate cuts priced in by December 2025 and Nasdaq surging 12.3%. While many are eager to fade this rally, it marks a trend reversal—and I don’t fade trend reversals.
We were in a tail-risk panic event. An event-driven recession was nearly 80% priced in. I no longer see a path to retest the lows but do see potential for new highs.
- In 2022, rate hikes were expected to cause a recession. In 2023, the SVB collapse was presumed to trigger one. In 2025, tariffs were the focus. Yet none materialized.
- Relying on fundamentals and economic forecasting for trading lacks humility. As a technical trader, I trust the tape—charts provide all the necessary insights.
Framework for Finding Fast Horses and Elephant Trades
The approach remains consistent: Technicals (30%), Flows (30%), Sentiment (20%), and Positioning (20%).
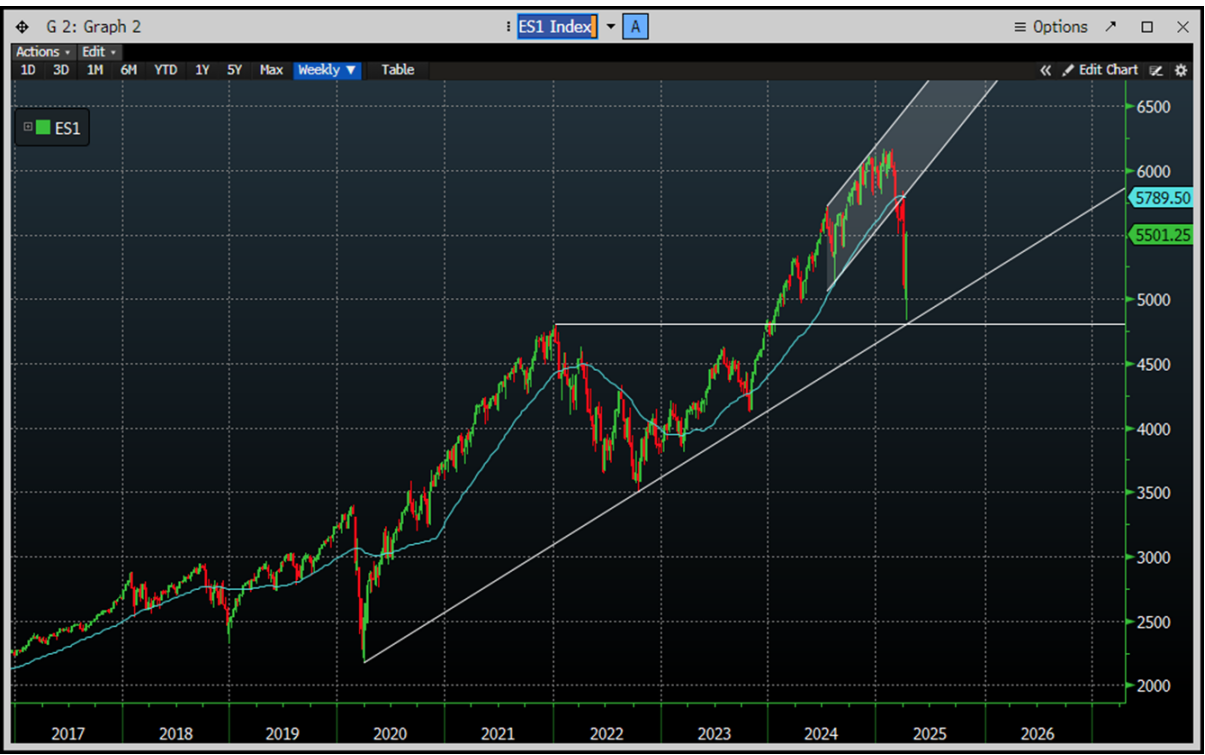
1. Technicals
- The recent market pattern mirrors 1929: a selloff on Thursday through Tuesday followed by a Wednesday rally. This signals bullish momentum.
- Following the November 1929 low, US equities rebounded 48% by April 1930 before resuming their decline.
- Since Monday’s low, we’ve consistently made higher lows without retesting that level. The VIX peaked, resembling August 24 patterns. This indicates a bottom.
- Currently, 29% of the S&P 500 has reached a 52-week low, aligning with medium-sized corrections seen in 2016, 2018, and 1998. This phase appears to be over.
2. Flows
- Buybacks are returning, supported by positive April seasonality and trade deals. CTA capitulation has been strong.
- There’s minimal pre-market supply from long-duration investors. Retail investors have been buying but still hold cash reserves. Corporate buybacks are set to restart on April 24.
- Hedge funds have been selling for nine consecutive weeks, marking the largest two-day macro product selloff in history. The squeeze is likely to continue.
- A reassessment of US exceptionalism is needed. The US is isolating China and reasserting Western hegemony.
3. Sentiment
- Extreme bearish sentiment dominates. Indicators like Bull/Bear ratios, GS Sentiment, and AAII Investor Sentiment are at historic lows.
- Bearishness is worse than during the COVID-19 crisis. GS sentiment is at its lows, and AAII sentiment is in the bottom 1%.
4. Fundamentals
- The second derivative of growth has turned more positive with rate cuts.
- Goldman Sachs’ baseline for Q4 2025 forecasts 0.5% GDP growth, 3.5% peak core PCE, and a 45% recession probability. This seems high unless tariffs reemerge.
- Higher growth reduces the likelihood of a cyclical recession.
All ideological recession trades should now be reversed. Focus on KRE, CL1, and ESA. US risk premia are declining. While inflation persists, higher growth with lower inflation is bullish for risk assets.
Bear market rallies can vary widely, ranging from 10% to 50%, with an average of 20-30%.
I remind myself of two rules:
1) Trust the charts.
2) Avoid emotions.
The bears had two arguments, which may still hold some weight:
1) Tariffs are ideological.
2) A recession isn’t fully priced in.
Trade based on technical levels, not fundamental opinions.
Disclaimer: The material provided is for information purposes only and should not be considered as investment advice. The views, information, or opinions expressed in the text belong solely to the author, and not to the author’s employer, organization, committee or other group or individual or company.
Past performance is not indicative of future results.
High Risk Warning: CFDs are complex instruments and come with a high risk of losing money rapidly due to leverage. 69% and 73% of retail investor accounts lose money when trading CFDs with Tickmill UK Ltd and Tickmill Europe Ltd respectively. You should consider whether you understand how CFDs work and whether you can afford to take the high risk of losing your money.
Futures and Options: Trading futures and options on margin carries a high degree of risk and may result in losses exceeding your initial investment. These products are not suitable for all investors. Ensure you fully understand the risks and take appropriate care to manage your risk.
Patrick has been involved in the financial markets for well over a decade as a self-educated professional trader and money manager. Flitting between the roles of market commentator, analyst and mentor, Patrick has improved the technical skills and psychological stance of literally hundreds of traders – coaching them to become savvy market operators!