Institutional Insights: Goldman Sachs SP500 Positioning & Key Levels 4/11/25

From GS Sales/Trading
Sources: Derived from internal high-frequency data sources (PB, Strats, Derivs/EPFR data, Pasquariello, Flood, EPFR, Kostin, Buybacks desk, Leyzerovich, etc.). Feel free to reach out for further details.
Key Takeaways:
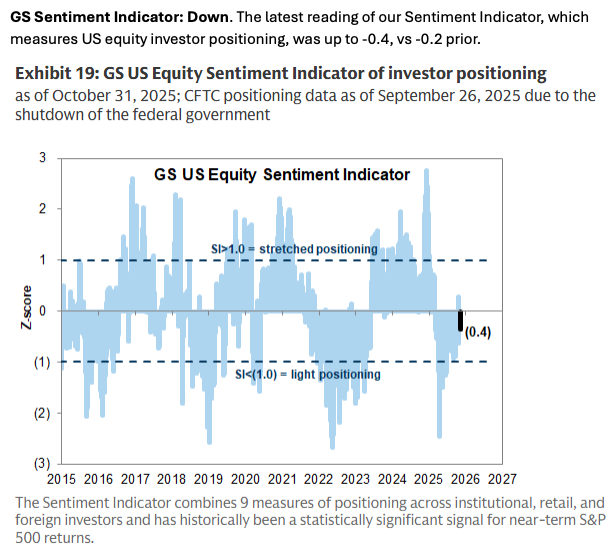
- Market Dynamics: A mix of factors contributed to the mid-week reversal in US equities: a more hawkish-than-expected Fed rate cut, the ongoing data vacuum caused by the government shutdown, earnings beats that failed to drive significant market reactions, and a rally driven by narrowing breadth.
- Investor Behavior: Professional investors responded cautiously:
- Long-Only (LO) funds and Hedge Funds (HFs) were net sellers, with outflows of -$3.5 billion and -$1.6 billion, respectively.
- Prime Brokerage (PB) stats indicate Hedge Funds were net buyers of global equities during the week but notably excluded US equities.
- Non-Economic Factors: The supply/demand balance continues to favor buying:
- CTA flows have slowed to minimal levels (positive or negative).
- Corporates significantly ramped up buyback activity since the quarter's start.
- Retail investors remain supportive, with consistent inflows into equity mutual funds and active trading in favored themes like Nuclear (+6.45% for the week) and Quantum Computing (+4.49%).
Upcoming Focus Points: Attention will be on numerous Fed speakers this week, Tesla's shareholder meeting (Thursday), and a test of historical seasonality trends, which have seen some misses this year.
Hedge Funds – Prime Brokerage Highlights:
- Global Metrics:
- Gross leverage increased by +1.0 points to 286.1% (70th percentile, 1-year).
- Net leverage rose by +0.8 points to 79.3% (87th percentile, 1-year).
- L/S ratio improved slightly by +0.4% to 1.767 (74th percentile, 1-year).
- Fundamental L/S gross leverage declined by -3.9 points to 207.2% (87th percentile, 1-year), while net leverage increased by +1.2 points to 55.9% (66th percentile, 1-year).
- Global Equity Activity:
- Net buying occurred for the second consecutive week (4 of the last 5 weeks, +0.3 SDs, 1-year).
- Gross trading activity saw the largest increase in four months, driven by long buys outpacing short sales (1.2:1 ratio).
- Every major region, excluding North America, experienced net buying, with Asia (DM + EM) leading the gains.
- Sector Trends:
- Single stocks were net bought for the second consecutive week (7 of the last 8 weeks), led by long buys.
- Macro products were net sold, primarily from short sales.
- 10 out of 11 global sectors were net bought, with Industrials, Information Technology, Energy, Financials, and Healthcare leading. Real Estate was the only sector that was net sold.
SYSTEMATIC: As of our latest update on Friday before the US market opened, our models indicated that CTAs had sold $1.5 billion in Global Equities over the week, slightly reducing their overall exposure to $173 billion (95th percentile over the past year). Looking ahead, our models project that CTAs will remain modest sellers across all market scenarios over a one-week horizon. Key level to monitor: 6672 serves as the short-term threshold for the S&P E-mini.
Summary:
1. CTA Corner: We have seen CTAs as small sellers in every scenario over the next week following the sale of $1.2 billion in global equities last week. Positioning remains strong, in the 94th percentile.
CTA Flows:
Over the next 1 week…
Flat tape: Sellers $3.6B ($1.48B out of the US)
Up tape: Sellers $2.25B ($2.26B out of the US)
Down tape: Sellers $31.55B ($7.84B out of the US)
Over the next 1 month…
Flat tape: Sellers $9.67B ($4.18B out of the US)
Up tape: Buyers $12.99B ($1.32B into the US)
Down tape: Sellers $205.3B ($67.2B out of the US)
Key pivot levels for SPX:
Short term: 6679
Med term: 6386
Long term: 5916

Disclaimer: The material provided is for information purposes only and should not be considered as investment advice. The views, information, or opinions expressed in the text belong solely to the author, and not to the author’s employer, organization, committee or other group or individual or company.
Past performance is not indicative of future results.
High Risk Warning: CFDs are complex instruments and come with a high risk of losing money rapidly due to leverage. 72% and 73% of retail investor accounts lose money when trading CFDs with Tickmill UK Ltd and Tickmill Europe Ltd respectively. You should consider whether you understand how CFDs work and whether you can afford to take the high risk of losing your money.
Futures and Options: Trading futures and options on margin carries a high degree of risk and may result in losses exceeding your initial investment. These products are not suitable for all investors. Ensure you fully understand the risks and take appropriate care to manage your risk.
Patrick has been involved in the financial markets for well over a decade as a self-educated professional trader and money manager. Flitting between the roles of market commentator, analyst and mentor, Patrick has improved the technical skills and psychological stance of literally hundreds of traders – coaching them to become savvy market operators!
