S&P500 Daily Action Areas & Price Targets 3/11/26

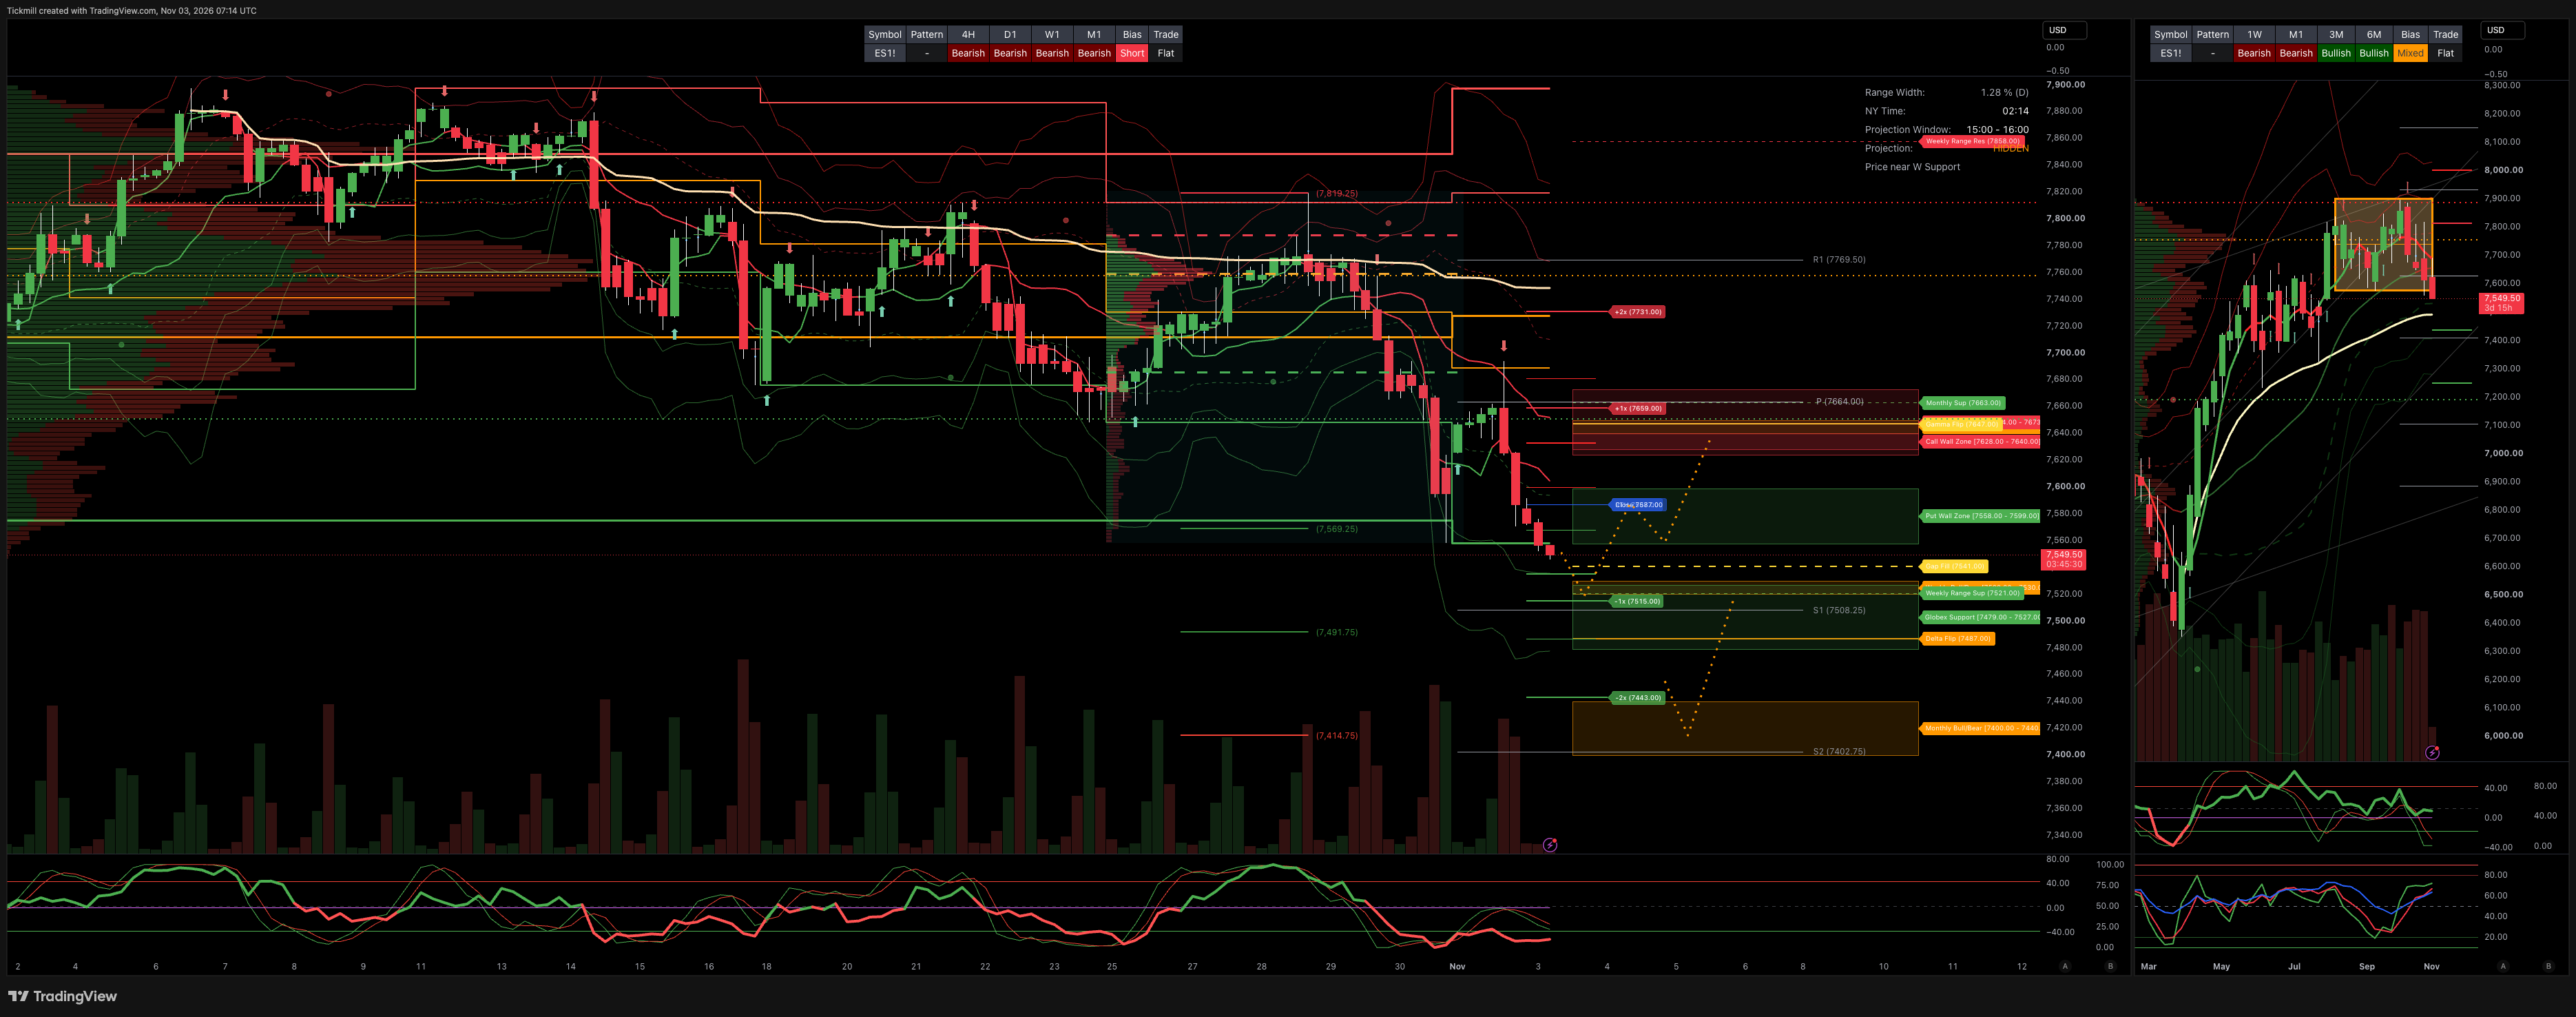
S&P500 Daily Action Areas & Price Targets 3/11/26
***QUOTING ES1!(Z CONTRACT LEVLES) FOR CASH US500 EQUIVALENT LEVELS, SUBTRACT POINT DIFFERENCE***
MONTHLY-WEEKLY& DAILY LEVELS
MONTHLY BULL BEAR ZONE 7440/7400
MONTHLY RANGE RES 7960 SUP 7663
WEEKLY BULL BEAR ZONE 7530/20
WEEKLY RANGE RES 7858 SUP 7521
DAILY BULL BEAR ZONE 7650/40
GLOBEX RANGE SUP 7527/7479 RES 7624/73
GAMMA FLIP 7647
DELTA FLIP 7487
CALL WALLS 7640/7628
PUT WALLS 7599/7558
GAP FILL 7541
DAILY STRUCTURE - BALANCE7693/7558
WEEKLY STRUCTURE - OTFL - 7794
MONTHLY STRUCTURE - BALANCE - 7897/7542
VIX BULL BEAR ZONE 18.72
VVIX-to-VIX The ratio of 5.22 compression is the main market driver, with the VVIX dropping more than the VIX, maintaining the ratio within the 5.0 to 6.0 range. This indicates a decrease in short-term tail risk insurance premiums, favoring volatility-selling strategies. Above 6.0 – 7.0+ signals higher risk and demand for options due to market volatility concerns.
PRIMARY TRADES & TARGETS
LONG ON REJECT/RECLAIM WBBZ TARGET RTH CLOSE
***ADDITIONAL SETUPS & TARGETS HIGHLIGHTED ON THE CHARTS***
(I FADE TESTS OF 2 SIGMA LEVELS ESPECIALLY INTO THE FINAL HOUR OF THE NY CASH SESSION AS 90% OF THE TIME WHEN TESTED THE MARKET WILL CLOSE ABOVE OR BELOW THESE LEVELS)
SPX PUT/CALL RATIO 1.13 (The numbers reflect options traded during the current session.) A put-call ratio below 0.7 is generally considered bullish, and a put-call ratio above 1.0 is generally considered bearish.
JHEQX Upside cap (~7,920–7,950): Dealer gamma hedging at this call strike creates resistance, with market makers likely selling futures into strength and limiting volatility. Downside cushion (~7,270): If SPX drops 5% into Q4, long put gamma may force dealers to buy futures as the index falls, helping stabilize prices. Expiration: December 31, 2026. Strong pinning effects are likely near key strikes into year-end expiration.
DEC2025 OPEX to DEC2026 OPEX is 945 points giving us a range of [5889,7779]
Notes On Structure Implications
Balance: This refers to a market condition where prices move within a defined range, reflecting uncertainty as participants await further market-generated information. Our approach to balance includes favouring fade trades at the range extremes (highs/lows) while preparing for potential breakout scenarios if the balance shifts.
One-Time Framing Higher (OTFH): This represents a market trend where each successive bar forms a higher low, signalling a strong and consistent upward movement.
One-Time Framing Lower (OTFL): This describes a market trend where each successive bar forms a lower high, indicating a pronounced and steady downward movement.
GOLDMAN SACHS FICC & EQUITY TRADING DESK VIEWS
THE TAKE: MOMENTUM BLEEDS AS S&P BREAKS BELOW CTA THRESHOLD (7,554)
US equities opened November on soggy footing, with an acute factor rotation away from crowded momentum and into defensive and consumer-levered laggards. While the Dow managed a modest gain (+41 bps to 51,983), the tech-heavy Nasdaq-100 tumbled -1.39% to 27,989, and the S&P 500 fell -51 bps to close at 7,541. Crucially, the S&P close at 7,541 breaches both its 100-day moving average (7,614) and the medium-term CTA systematic threshold (7,554), signaling that programmatic trend-following selling pressure remains an active threat.
Factor dispersion was violent: High Beta Momentum bled lower by -6.7%, while factor laggards gained +1.0%, allowing S&P 500 Equal Weight to outperform the headline cap-weighted index by ~125 bps. The Philadelphia Semiconductor Index (SOX) extended its multi-session slide after closing below its 200-day moving average on Friday for the first time since June 2025.
Cross-asset volatility spiked as downside demand re-accelerated into Election Day: the VIX jumped +9.22% to close at 21.22, even as macro input costs provided significant relief with WTI Crude plunging -7.85% to $95.94/bbl and the US 10-Year Treasury yield easing to 4.91%.
MARKET SUMMARY & ASSET BREAKDOWN
S&P 500 (SPX): Closed at 7,541.00 (-0.51%) | MOC $2.0B to BUY | VIX up +9.22% to 21.22
Nasdaq-100 (NDX): Closed at 27,989.00 (-1.39%) | Pressured by persistent semi selling and heavy primary issuance
Russell 2000 (RUT): Closed at 2,809.00 (-0.07%) | Broadly flat, insulated by rate relief and consumer strength
Dow Jones (DJI): Closed at 51,983.00 (+0.41%) | Outperformed on traditional value and staples rotation
US 10-Year Treasury: Yield down -1 bp to 4.91% | Broke below the 5.00% benchmark handle
WTI Crude: Price down -7.85% to $95.94/bbl | Sharp retreat below $96/bbl easing top-line input costs
Gold: Price up +1.84% to $3,945.00/oz | Rebounded on flight-to-safety flows
Bitcoin: Price down -1.32% to $76,769.00 | Retreated alongside broader risk-off momentum
US Dollar Index (DXY): Down -13 bps to 101.74 | Softened in tandem with US Treasury yields
INSTITUTIONAL DESK FLOWS & ROTATION COLOR
Execution Floor Activity (3/10 Rating):
Trading floor activity was subdued at a 3/10, though flow skews remained directionally aligned with late last week.
Asset Managers (LOs): Finished as moderate net sellers, led by persistent liquidations in large-cap technology.
Hedge Funds (HFs): Finished as moderate net buyers on muted notional, characterized by scattered short-covering demand across Industrials, Tech, and Healthcare.
Semiconductor Supply vs. Zero Defense: Bartlett noted that sizable semiconductor sell tickets from Friday carried over into Monday. While overall sell skew was slightly less aggressive than last week's peaks, the selling was met with virtually zero bids or institutional defense. Market participants remain focused on the absorption capacity of the debt and equity capital raises hitting the street to finance the AI buildout.
Consumer-Levered Inflows: Lower oil prices sparked a palpable rotation into Consumer Discretionary (+2.0%), lifting consumer-levered internet names (e.g., Amazon
AMZN).
POST-BELL CATALYST: APPLE (AAPL) EARNINGS FIRST TAKE
Share Price Reaction: Hovering essentially flat post-market.
Print Breakdown: Viewed as fundamentally "solid," with market attention centering purely on valuation multiple sustainability:
Product Revenue: Came in a touch better than consensus.
Services & China Revenue: Printed a touch softer than expectations.
Capital Return Standout: Apple returned $28 billion to shareholders in the quarter, remaining a clear standout in disciplined shareholder yield relative to hyperscaler peers engaging in heavy capex.
Conference Call Priorities (5:00 PM ET):
Commentary around "Duo" and upcoming hardware releases.
Calendar Q4 gross margin guidance.
Calendar Q4 revenue growth guidance vs. consensus expectations of +6% YoY.
ELECTION DAY & FISCAL HORIZON (NOVEMBER 3)
Midterm Baseline Odds: Prediction markets and polling establish Democrats at >90% probability to capture the House majority, setting up a divided government.
GIR Macro Assessment: GS GIR anticipates limited immediate structural shocks at the index level. Divided government eliminates major legislative overhauls, focusing risk on trade policy (~2-point hike in effective tariff rates) and fiscal negotiations surrounding the December 11 government funding deadline.
Disclaimer: The material provided is for information purposes only and should not be considered as investment advice. The views, information, or opinions expressed in the text belong solely to the author, and not to the author’s employer, organization, committee or other group or individual or company.
Past performance is not indicative of future results.
High Risk Warning: CFDs are complex instruments and come with a high risk of losing money rapidly due to leverage. 68% and 74% of retail investor accounts lose money when trading CFDs with Tickmill UK Ltd and Tickmill Europe Ltd respectively. You should consider whether you understand how CFDs work and whether you can afford to take the high risk of losing your money.
Futures and Options: Trading futures and options on margin carries a high degree of risk and may result in losses exceeding your initial investment. These products are not suitable for all investors. Ensure you fully understand the risks and take appropriate care to manage your risk.
Patrick has been involved in the financial markets for well over a decade as a self-educated professional trader and money manager. Flitting between the roles of market commentator, analyst and mentor, Patrick has improved the technical skills and psychological stance of literally hundreds of traders – coaching them to become savvy market operators!